The demographics of the dental school landscape continue to evolve. Research from the University of Virginia School of Medicine and the American Dental Education Association (ADEA) shows how the latest incoming classes differ significantly from when more seasoned dentists entered school.
Since 2010, for example, there has been a gradual decline in the number of people taking the Dental Admission Test (DAT). Also, the number of applicants has remained relatively flat, though the number of first-year dental students has continuously increased. As a result, there is an increasing rate of enrollment among applicants.
Since 2010, the number of first-time, first-year enrollees increased by 945 to 2014’s total of 5,892. In 2014, 47% of all applicants ultimately enrolled in dental school, and in 2015, 50% of all applicants enrolled. The researchers attribute the steady increase in enrollment to new schools, expanding class sizes at existing schools, and new evaluation methods.
“One explanation for the increased share of applicants gaining admission to dental school is that many schools have moved to holistic admissions where personal attributes and experiences are considered in addition to grades and test scores,” said Bryan J. Cook, PhD, senior vice president of educational research and analysis at the ADEA.
“This allows dental schools to admit many highly qualified candidates who might otherwise be overlooked to a narrow focus on numbers only as the criterion for developing a dental school class,” Cook said.
In fact, 93% dental schools now use some aspect of a holistic admissions process, which helps universities “consider a broad range of factors reflecting the applicant’s academic readiness, contribution to the incoming class, and potential for success both in school and later as a professional,” according to the Urban Universities of Health.
DAT scores and grade point averages (GPAs) still matter though, and they’re rising too. Since 2000, average science GPAs among applicants have increased from 3.08 to 3.26, and average total GPAs have increased from 3.20 to 3.38. DAT academic averages among applicants have gone from 17.8 to 18.9, DAT perceptual ability averages have risen from 17.1 to 19.3, and DAT total science averages went from 17.5 to 18.7.
The number of women applying and enrolling is growing too. In 2000, men made up 59.7% and women made up 40.3% of applicants. In 2014, men accounted for 50.4% and women were 48.4% of applicants. In 2000, 1,504 more men applied than women. By 2014, though, only 239 more men than women applied.
“With the exception of the most recent year, since 2010 the percent of female applicants has increased as the actual number of male applicants has fluctuated. This means the number of female applicants is increasing faster and more consistently than male applicants. Despite the decrease in male applicants in 2014, since 2004 the number of male applicants to dental school is actually up 12%,” said Cook.
“This follows broader trends in higher education, where the number of women graduates earning bachelor’s degrees has grown at a more rapid rate than that of men. From 2012 to 2013, 34% more women graduated with bachelor’s degrees from postsecondary institutions than men,” Cook said.
The researchers examined data on race and ethnicity as well. Among underrepresented minorities, there remains a low number of applicants and a lower than average enrollment rate. The largest ethnic group among applicants and enrollees was white, followed by Asian, making up 75% of applicants and 77% of enrollees combined in 2014.
Meanwhile, the number of underrepresented minority applicants remains low, with a lower than average enrollment rate. Black or African American, Hispanic/Latino, American Indian/Alaska native, and native Hawaiian/Pacific islander constituted 14% of applicants and 13% of enrollees in 2014. Remaining applicants and enrollees reported 2 or more races, were unknown/unreported, or were nonresident aliens.
“Increasing the racial and ethnic diversity of the applicant pool is going to require a multipronged approach, and it requires time to make a measurable difference. The most widely used best practices include more targeted recruitment and outreach efforts to encourage these candidates to apply to dental school,” Cook said.
“This targeted recruitment involves creating more middle and high school programs that offer both academic and career experiences that will not only expose them to a dental career but also support their dental career preparation. These efforts also need to be paired with overall mission-based policies that make creating a diverse environment a priority,” Cook said.
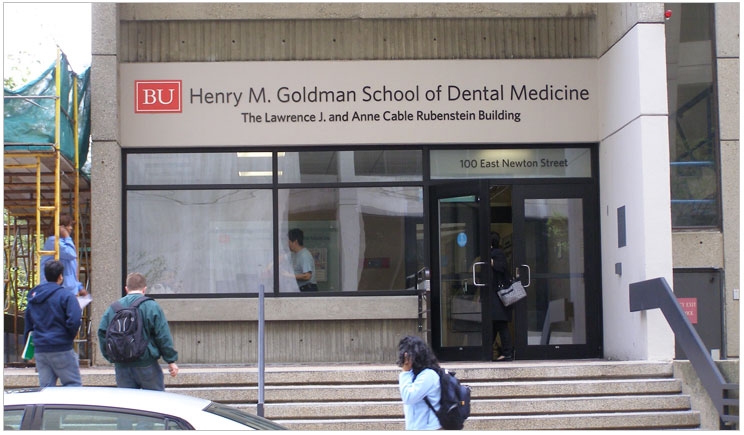
And, the data revealed which schools got the most applicants in the 2013 to 2014 cycle: The New York University College of Dentistry had the most with 4,581, followed by Boston University Henry M. Goldman School of Dental Medicine at 4,118, and Tufts University School of Dental Medicine at 3,662.
Also in 2014, 11,745 applicants submitted 114,924 applications to the 65 dental schools in the United States, for an average of 10 applications per applicant. Schools varied in the number of applicants per enrollee, ranging from 8 to 43.
Data was drawn from the ADEA’s Associated American Dental Schools Application Service, which is the centralized application service for all US and selected Canadian dental schools, and its 2013 to 2014 application cycle. The study, “U.S. Dental School Applicants and Enrollees, 2014 Entering Class,” was published by the Journal of Dental Education.
Related Articles
Emotional Intelligence Key to Student Success
Student Develops One-Shot Root Canal Alternative


